Introduction
This page was written because of a query by gabrield in the API user-supported group
gabrield simply wanted to know if there was a way to have multiple units in the y-axis markings, in their case Celcius / Fahrenheit. I don't think this is possible as the values are calculated by the API, but I can see where being able to do something like this could be useful for all sorts of units, for example mph / km/h and so on.
I already have a Google Sheet with a range of temperatures in Fahrenheit that I can use as the source data. There is a formula to convert to Fahrenheit to Celcius and that is:
Subtract 32 and multiply by 0.5556 (or 5/9)
I could add another column to the spreadsheet and do the conversions there, or I can do the calculation and add the column in the chart code.I chose to do the latter on this page.
Incidentally, the formula for converting Celcius to Fahrenheit is:
Multiply by 1.8 (or 9/5) and add 32
The Chart
The Code
The code for the above chart is:
<script type="text/javascript">
    // Load Charts and the corechart package.
    google.charts.load('current', {'packages':['corechart']});
    google.charts.setOnLoadCallback(drawChart);

    function drawChart() {
   		var queryString = encodeURIComponent('SELECT A,B ORDER BY A');
   		var query = new google.visualization.Query('https://docs.google.com/spreadsheets/d/1tswaWUAbeBijHq4o505w0h7TmbD-qGhR3jBactcbGq0/gviz/tq?gid=464392919&headers=1&tq=' + queryString);
   		query.send(handleQueryResponse);
	}

	function handleQueryResponse(response) {
   		if (response.isError()) {
   			alert('Error in query: ' + response.getMessage() + ' ' + response.getDetailedMessage());
   		return;
	}

	var data = response.getDataTable();
 	function doConversion(temp) {
		return (temp - 32) * 0.5556;
 	}

	// Set the column label properly for Fahrenheit
	data.setColumnLabel(1, "Fahrenheit");
	// Create a new column to hold the custom tooltips for Fahrenheit
	data.addColumn({'type': 'string', 'role': 'tooltip', 'p': {'html': true}});
	// Create a new column to hold the Celcius values
	data.addColumn("number", "Celcius");
	// Create a new column to hold the custom tooltips for Celcius
	data.addColumn({'type': 'string', 'role': 'tooltip', 'p': {'html': true}});

	// Data table is now Date/Time | Fahrenheit | Fahrenheit Tooltip | Celcius | Celcius Tooltip
	// Get the number of rows in the data
	var totalRows= data.getNumberOfRows();

	for (i = 0; i < totalRows; i++) {
		// Create the Celcius (column 3) from Fahrenheit data (column 1)
		fTemp = data.getValue(i,1);
		cTemp = doConversion(fTemp)
		data.setCell(i, 3, cTemp);
		// Create the tooltip string in columns 2 and  4
		var tooltipStr = '<div style="padding:0 10px;"><p>Date/Time: <b>' + data.getFormattedValue(i,0) + '</b></p><p>Fahrenheit: <b>' + data.getValue(i,1) + '</b><br>Celcius: <b>' + Math.round((data.getValue(i,3)+ Number.EPSILON) * 100) / 100 + '</b></p></div>';
		data.setValue(i, 2, tooltipStr);
		data.setValue(i, 4, tooltipStr);
	}

	var fMin = data.getColumnRange(1).min -5;
	var cMin = doConversion(fMin)
	var fMax = data.getColumnRange(1).max + 5;
	var cMax = doConversion(fMax)

	var options = {
		tooltip: {isHtml: true},
		legend: 'none',
		height: '200',
		hAxis: {format: 'M/d/yyyy H:m:s'},
		series: {
        	0: {targetAxisIndex: 0,},
          	1: {targetAxisIndex: 1,}
    	},
		vAxes: {
			0: {title: 'Temp: Fahrenheit',
			viewWindow: {
          		min: fMin,
          		max: fMax
			}
		},
		1: {title: 'Temp: Celcius',
			viewWindow: {
          		min: cMin,
          		max: cMax
			},
		ticks: [ -15, -10, 0, 10, 15, 20, 30 ]
		}
	}
};

	var Chart = new google.visualization.LineChart(document.getElementById('chart-div'));
	Chart.draw(data, options);
	}
	</script>
Data Structure
When the data is imported from the spreadsheet, only two columns are used, the date/time and temperature in Fahrenheit. Three more columns are added to this structure. The tooltips for the Fahrenheit column, the calculated Celcius temperatures and the tooltips for the Celcius column. From the Column Roles documentation, the tooltip role columns only affect the nearest left neighbour, so two tooltip role columns are needed. If only one is used then the user-defined tooltips are only applied to one graph, and the other gets the standard API-defined tooltip:
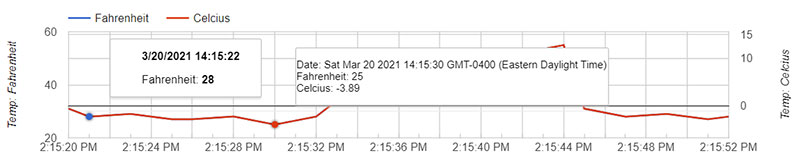
API-defined (left) and user-defined (right) tooltips - more work is needed on the user-defined tooltips as shown here.
Drawing and Adjusting the Graph Lines
The Google Charts API is not designed to do what we are doing here - providing a direct correlation between the two y-axes. Instead, it was designed to show two different graph lines as a best fit in the chart area. In order to create the correlation for example between Fahrenheit and Celcius or mpg and km/h, the scales must be changed using vAxes viewWindow parameter. If this is not done, because the values are different, the graph lines will not line up properly, giving the graphs below:
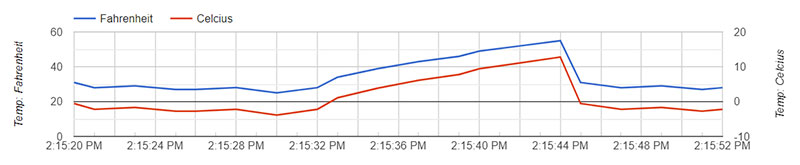
Improperly aligned graph lines
Formatting the HAxis
The data for the chart comes from a Google Sheet. Data cells contain two values, the underlying value (v) and the formatted value (f). To get the value of a data cell then getValue(rowIndex, columnIndex) can be used, to get the formatted value then use getFormattedValue(rowIndex, columnIndex). Using these functions, although the Google Sheet date/time cell contains 3/20/2021 14:15:20, the imported value is a cell contains the value of Sat Mar 20 2021 14:15:21 GMT-0400 (Eastern Daylight Time) and the formatted value of 3/20/2021 14:15:22
It would be nice the the hAxis used the formatted value, but instead it displays 2:15:20 PM UTC-4, which is definitely not how I would like it displayed. This is easily solved by putting hAxis: {format: 'M/d/yyyy H:m:s'} in the chart options. There is a list of accepted options for date and time in the More About Date Patterns section of the documentation.
Tooltip Definition
The columns for the tooltip data were added using data.addColumn({'type': 'string', 'role': 'tooltip', 'p': {'html': true}}); to define the column as containing HTML, this not enough to format the tooltips. tooltip: {isHtml: true} must also be added to the general chart options. If either is missing, the tooltips will simply display as plain text and any HTML or CSS formatting will not be applied to them. This is explained in Customizing HTML Content in the documentation.
The HTML/CSS tooltip string is:
'<div style="padding:0 10px;"><p>Date/Time: <b>' + data.getFormattedValue(i,0) + '</b></p><p>Fahrenheit: <b>' + data.getValue(i,1) + '</b><br>Celcius: <b>' + Math.round((data.getValue(i,3)+ Number.EPSILON) * 100) / 100 + '</b></p></div>'
Formatting the Date/Time in the Tooltips
It is the formatted value that is wanted in the tooltips and so it is getFormattedValue(rowIndex, columnIndex) that is used when creating them.
Formatting the Celcius Values in the Tooltips
As calculated from the Farhenheit temperatures, the conversion to Celcius is done to four decimal places. This is to ensure that the graph lines match up exactly. For the tooltips, no such precision is needed and so Math.round((data.getValue(i,3)+ Number.EPSILON) * 100) / 100 is used to get the number down to two decimal places which is still probably more precision than is needed.
There are other methods for doing this. For example a formatted value could be added to the column of Celcius temperatures using setCell. The format could also be changed using a Number Formatter.
Number.EPSILON
Number.EPSILON is mentioned a few times. Offically it is a static data property represents the difference between 1 and the smallest floating point number greater than 1. For practical use it can be used to help avoid rounding errors. A floating point number is any number that contains a decimal point. and Number.EPSILON is being used here as I am using 0.5556 in the conversion from Fahrenheit to Celcius.
Sources and Further Reading
Bug: Dual Y axis chart problem - The original discussion on why dual y-axis chart scales need adjusting
CSS for HTML tooltip
Google Charts API: Column Roles - Column Roles and how to define them
Google Charts API: Dates and Times - Working with dates and times
Google Charts API: Formatters - Data formatters and how to use them
Google Charts API: Line Chart - Documentation includes that for Dual-Y Charts
Google Charts API: Tooltips - How to create and manage tooltips
Having fun with Google charts: double y-axes and more! - An example of a dual y-axis chart by Marina Mele (Internet Archive)
How to have the Y axis labels show both Celsius and Fahrenheit in a line chart - The query that started this page
Number.EPSILON (MDN Docs)
Two Temperature Axes - The JSFiddle help Daniel LaLiberte gave me to fix the y-axes
What are the possible usage scenarios for Number.EPSILON? (Stack Overflow)