Introduction
Interpreting web log files from the raw text is impossible which is why they need to be visualized. Using the log file visualizers and analyzers it is relatively easy to spot spikes, trends, and patterns in the data. Once you know about unusual activity then it can be investigated. Is it a natural trend as the website becomes more popular? Is it bot activity? If it's a bad bot, what is it doing?
In the following example, the graphs are from Analog and they have been rotated to lie horizontally.
An Example
Looking through the Analog Monthly Report, I saw the server, since around Novermber 2022, was getting a lot more traffic than it had previously.
Analog's Monthly Report
It would be nice to think this was all human traffic, but I doubted it because the extra traffic was too abrupt.
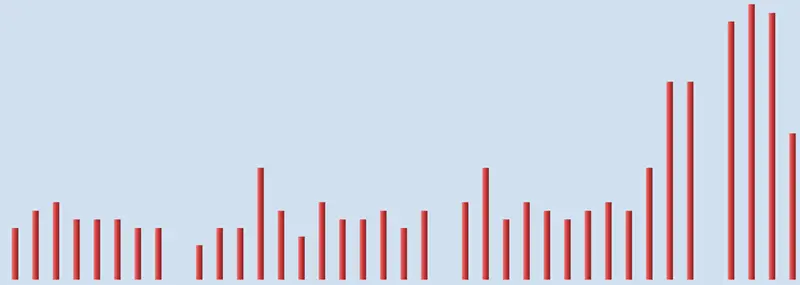
Analog's Weekly Report
Analog's weekly report showed that every two weeks, starting from October 23, 2022, there were huge spikes in the traffic to the site. Whatever was causing them was not human. So, what bot was visiting the site and what was it doing?

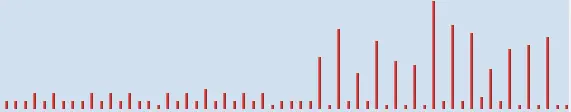
Analog's Daily Report
The daily report confirms that the spikes occured every two week, and the dates show it was always on a Friday.
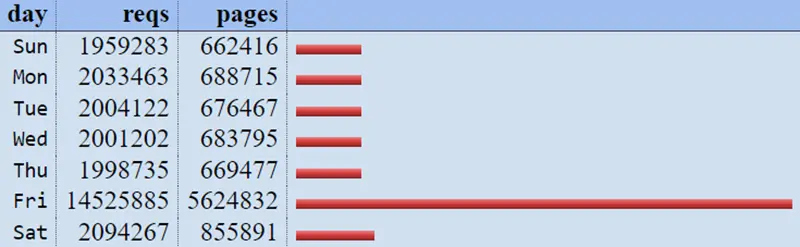
Analog's Daily Summary
The daily summary confirms the extra traffic was seen on Friday's and show that around 7x the normal amount of pages and files were being requested from the server.
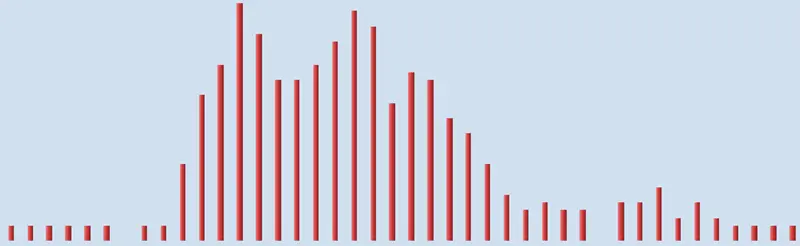
Analog's Hour of the Week Summary
The hour of the week summary shows the server experiences heavier traffic between 2am and 7pm on Fridays, and the earlier charts show this occurs on alternate weeks. Time to look at the logs for these dates and times or better still, query the logs using Log Parser to see what is going on. I used Log Parser to query which user agent was making the most requests on the affected days:
Here's a complete command line I used (all on one line):
logparser -i:ncsa "SELECT top 10 User-Agent, count (User-Agent) as requestcount FROM 'C:\Users\brisr\Documents\logtest\brisray-access-2023-03.log' where to_string(to_date(DateTime),'dd/MMM/yyyy') = '17/Mar/2023' GROUP BY User-Agent ORDER BY count(User-Agent) DESC"
Here's the output of the above command at prompt:
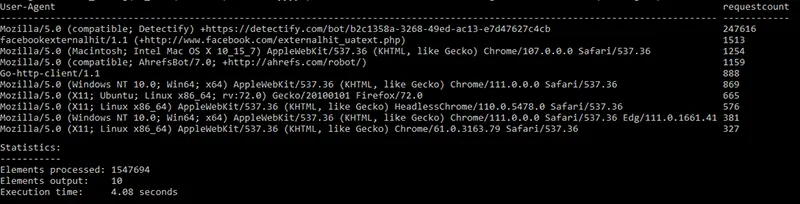
Output of the above command
As I suspected, a single user agent is making many, many more times requests than is normal
I used the same query in Log Parser Studio:
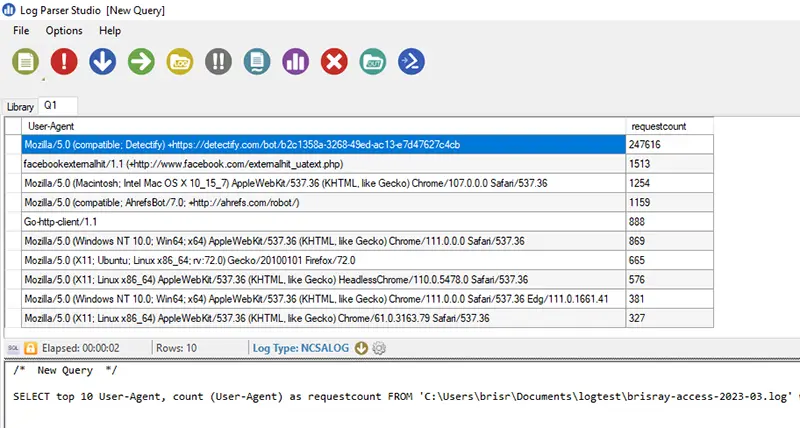
The same query as above in Log Parser Studio
The user agent Mozilla/5.0 (compatible; Detectify) +https://detectify.com/bot/b2c1358a-3268-49ed-ac13-e7d47627c4cb made 247,616 requests in a single day. Detectify is a very good, highly rated security scanner. Some years ago, around February 2015, they offered free scans for non-commercial sites which I signed up for. I didn't realize what an impact it might have. The user agent string is Mozilla/5.0 (compatible; Detectify) +https://detectify.com/bot/(token) so shouldn't be too difficult to add.
Mitigation
Detectify is very well respected and thorough in its scans. It is really meant for medium to large sites, I just happened to take advantage of the free account they offered. Over the years my scan scores is currently 5.8 on their scale, with no high or critical problems, which they class as a medium vulnerability risk.
If your score is between 4.0-6.9, you most likely have several Medium severity vulnerabilities on your site. About 90% of our users have Medium vulnerabilities, so you are not alone. As mentioned earlier, when these vulnerabilities are combined with each other, they can pose a very high risk, so we recommend you to fix them as soon as possible. - How to interpret your Detectify score
I could improve my score a lot if I blocked directory listing on some sections of my site which seems to be the single most effective action I can take.
My immediate thought was of pausing their scans from my account with them or even deleting it as it does skew the statistics for my site. Then I realized my "Server in the Cellar" is not being too adversely affected by the scans. All of the log analyzers I use were written long before Detectify existed - they were formed in 2013, so it seems the best course of action is for me to add Detectify's bots to the lists of known bots the analyzers use.